Eight thousand stores, one process
How we measured Helium's origin performance, removed repeated render work, and kept the memory story honest.
The most misleading number in our first Helium load comparison was a very fast response. It was a 503. Once the renderer was busy, rejecting requests quickly made raw throughput look healthy. The shop was serving errors faster.
That changed the question. How many successful pages can the origin return, what happens at the tail, and does memory settle after thousands of unrelated stores pass through it?
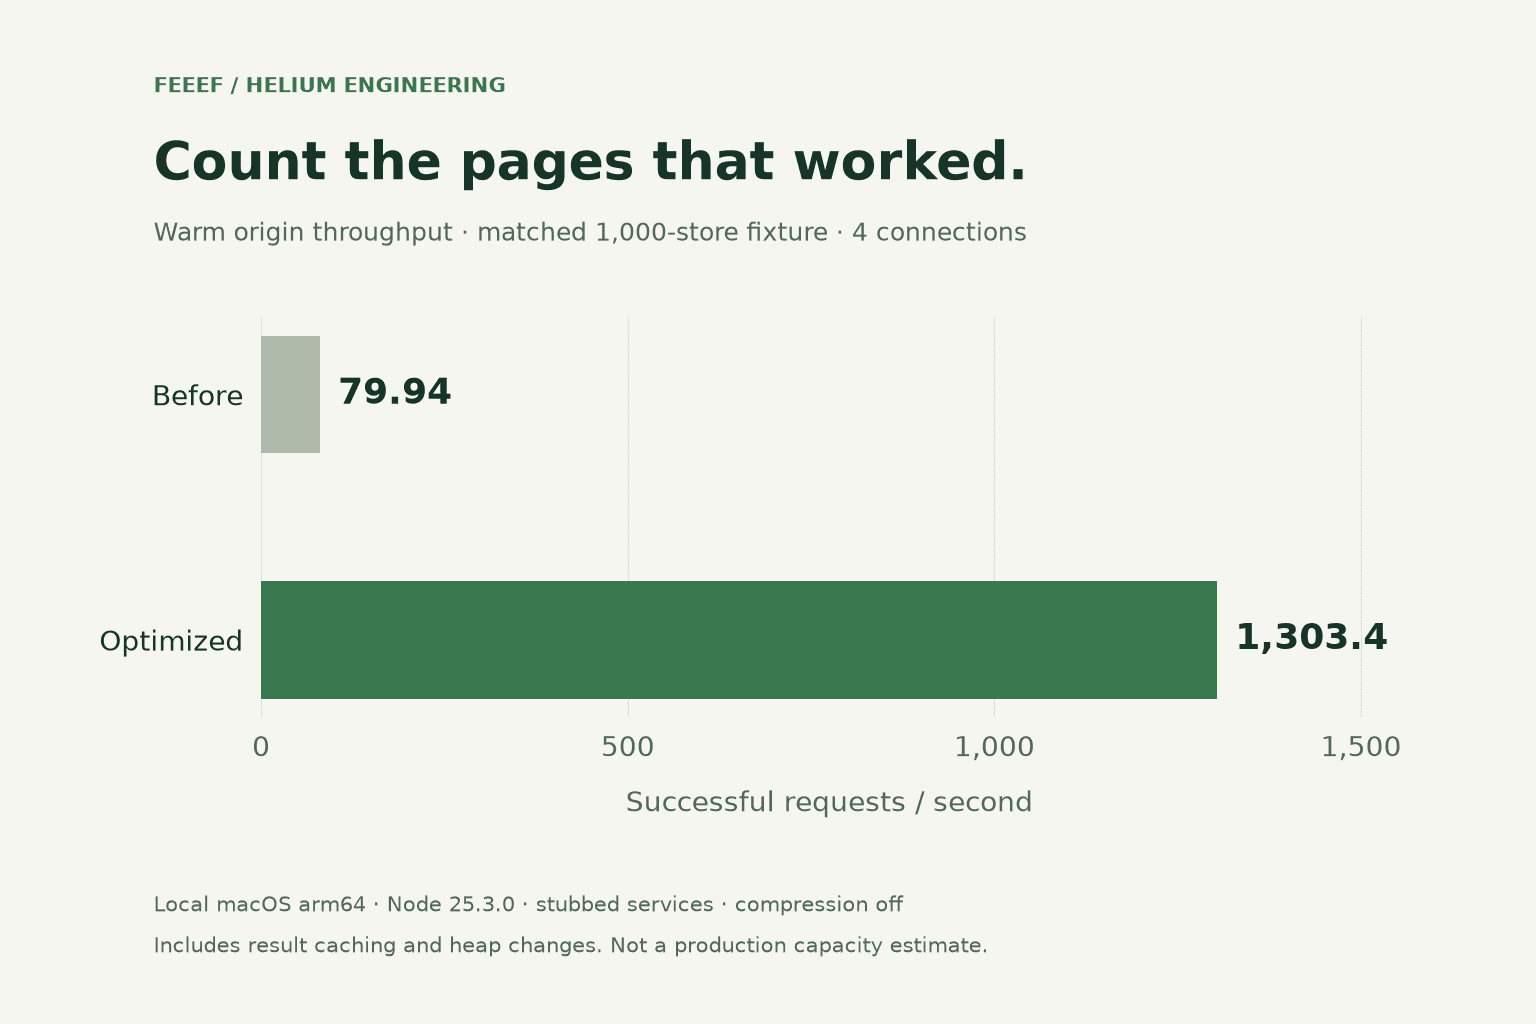
We now have a repeatable harness and a first set of results. In a matched local run, warm successful throughput at four connections moved from 79.94 to 1,303.4 requests per second. The p99 moved from 82 ms to 9 ms. Here is what those numbers include.
Start with a comparison we can explain
Both versions first rendered 2,000 home and product pages across 1,000 synthetic stores. Every tenth store had a distinct valid theme release. We then ran the same mixed home, product, catalogue and cart workload at 4, 16 and 48 connections, for ten seconds each.
| Origin measurement | Before | Optimized |
|---|---|---|
| Successful requests/s, 4 connections | 79.94 | 1,303.4 |
| p99, 4 connections | 82 ms | 9 ms |
| Successful requests/s, 48 connections | 59.03 | 1,466.3 |
| HTTP failures, 48 connections | 94,168 | 0 |
| Highest sampled RSS, 48 connections | 268.5 MiB | 137.1 MiB |
| Initial tenant sweep | 60.5 s | 53.4 s |
We count successful responses separately from non-2xx responses, timeouts and render errors. The baseline's low latency at overload is not a win: most responses in that phase were errors. The improved run served the workload without those failures.
The hardware and boundaries are part of the result: Node v25.3.0, macOS arm64, eight available logical CPUs, with no production one-CPU limit. The local API and geo responses were stubbed; remote images, image optimization, orders and compression were disabled. There was no forced garbage collection. This is a storefront origin test.
Remove repeated work before adding capacity
The most useful change was a bounded cache for public render results: ten seconds and 2 MiB, keyed by the full page input snapshot. Concurrent requests for the same result share the pending render. Drafts, previews and thank-you pages bypass it, and failed renders are not cached.
That distinction is why the warm throughput gain is much larger than the cold-sweep gain. It measures avoided work as well as rendering. It does not mean QuickJS execution became sixteen times faster.
We also reduced the work that crosses the worker boundary. A job receives the relevant page projection, and inputs travel as data instead of escaped JavaScript source. Raw template objects are weakly interned; byte-bounded caches reject entries larger than their entire allowance. Workers start on demand and recycle after 1,000 jobs.
The Node heap profile changed too: the old-generation limit went from 384 MiB to 96 MiB, with 2 MiB semi-spaces. This is part of the measured optimization, not a separate experiment. The V8 heap limit alone is not a process RSS limit; workers and WASM memory also count.
Every newly executed merchant render still gets a fresh QuickJS runtime. We kept the guest memory and execution limits and the independent wall watchdog. Reuse happens around that boundary, without keeping merchant globals alive between jobs.
Then make the tenant set much bigger
The follow-up soak exercised 8,000 stores, 800 mutated releases plus a shared base theme, and 16,000 home/product requests. Four unrelated tenants were in flight at once, exercising both renderer workers. The sweep took 197.6 seconds and returned zero HTTP or render errors.
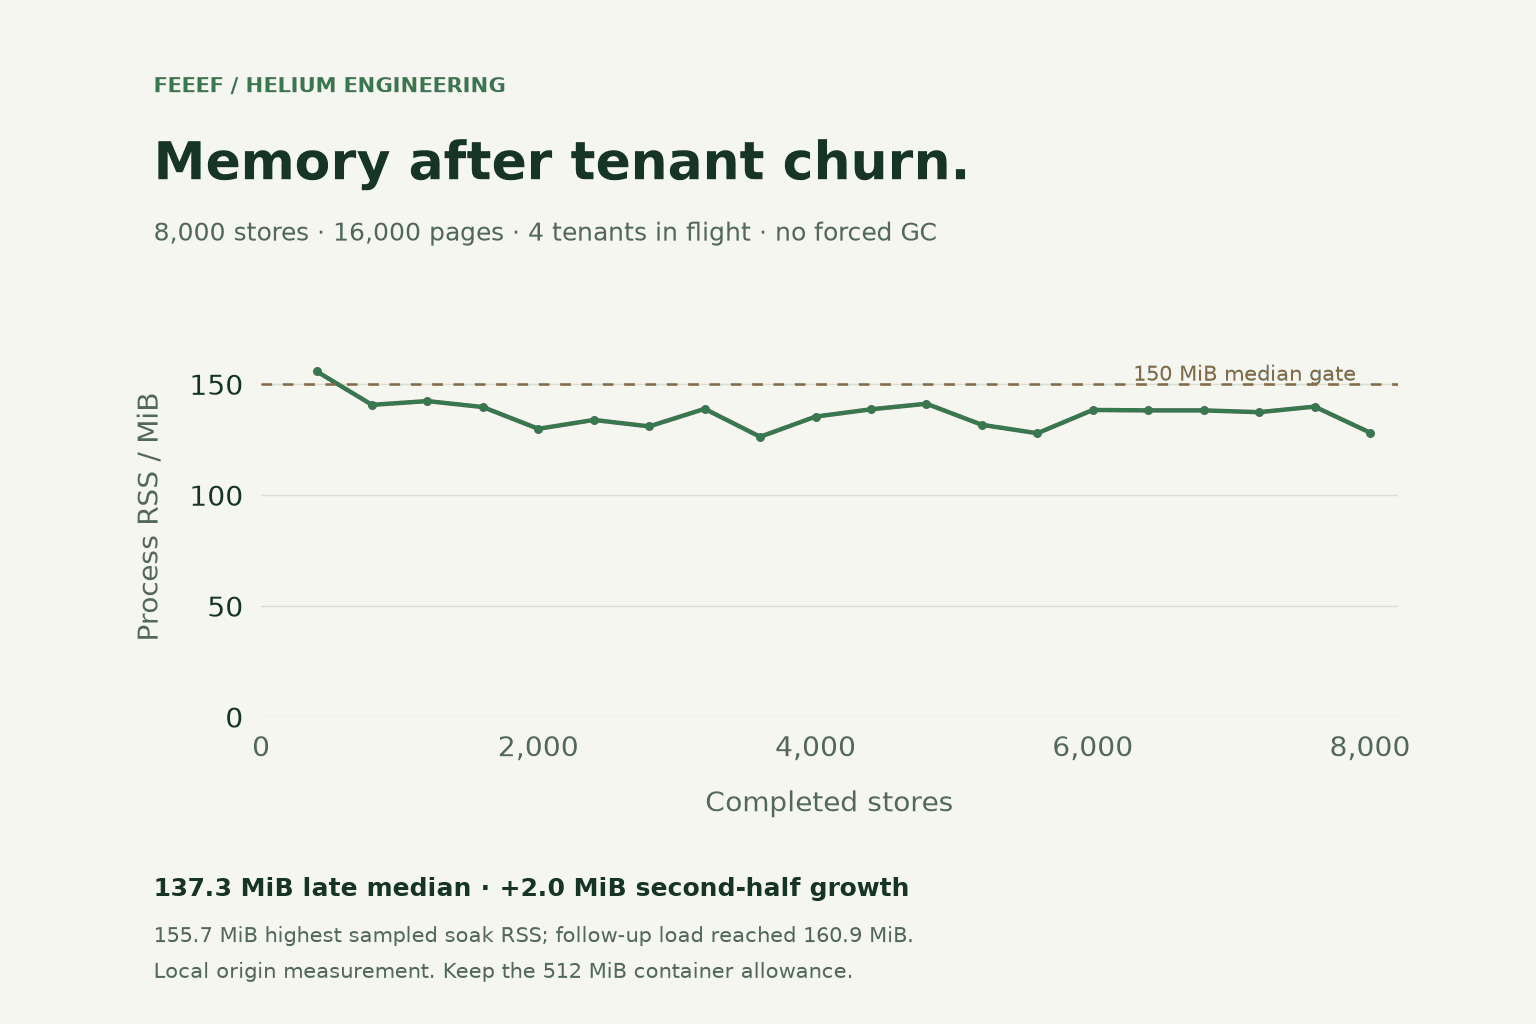
The middle-of-soak RSS median was 135.3 MiB; the late median was 137.3 MiB, a 2.0 MiB increase. At the end of the sweep, the store cache held 354 records and the compiled release cache held 39 releases. Each worker's sampled WASM heap remained at 16 MiB.
That passed the harness's steady-state gate: late median at most 150 MiB, second-half median growth at most 10 MiB, and no errors. It is a useful regression gate, not proof that memory can never grow over a longer run.
The highest sampled soak RSS was 155.7 MiB. Follow-up warm load reached 160.9 MiB, and the final post-load sample was 151.1 MiB. We are keeping the 512 MiB container allowance. A headline saying “8,000 stores under 150 MiB” would hide the peaks.
Keep the result reproducible
From a Helium checkout:
npm ci
npm run build
LABEL=matched STORES=1000 TENANT_CONCURRENCY=1 npm run bench:load
LABEL=long-soak STORES=8000 TENANT_CONCURRENCY=4 npm run bench:load
LABEL=memory STORES=8000 TENANT_CONCURRENCY=4 npm run bench:memory
The harness starts its own production server, checks response bodies for render errors and writes JSON reports. It fails on the RSS/growth gates, failed requests or excessive p99 latency. Use the same Node version, heap flags, fixture and worker configuration for comparisons.
The published benchmark data includes the matched results, workload notes and sampled RSS series behind these figures. The renderer regression suite also passed all 159 tests, TypeScript checking and the production build at this snapshot.
The next useful evidence is the same workload in the Linux deployment, followed by real backend and image traffic. Lighthouse and field Core Web Vitals answer a separate question: what the shopper experiences. We will measure those separately. For theme-side work now, start with hydration by intent and the performance guide.
Introducing the Feeef Template Design System
Why themes are documents, how JSON and React meet, and what that means for merchants, developers, and the storefront.
Meet Helium, the new home for Feeef themes
A smaller storefront runtime, the same editable theme document, and a clearer boundary between merchant code and the platform.